
Adult literacy remains a major U.S. education and workforce issue, with the national Program for the International Assessment of Adult Competencies (PIAAC) based estimates suggesting that roughly one in five adults falls at or below Level 1 literacy, a level associated with difficulty interpreting simple written information and completing everyday reading tasks. State and county estimates show that literacy challenges are not spread evenly: they are concentrated in a relatively small number of large states and in specific local communities, especially where poverty and lower educational attainment are more common.
A new report by National University uses these estimates to highlight where low literacy is most concentrated and how expanded education opportunities may help improve both reading skills and long-term economic mobility.
Key Takeaways
- 21.8% of U.S. adults are at or below Level 1 literacy, 32.3% are at Level 2, and 45.8% are at Level 3 or above.
- State rates vary sharply, from 29.1% at or below Level 1 in New Mexico to 11.5% in New Hampshire, creating an approximately 2.5-fold gap between the highest and lowest state estimates.
- In several counties with populations of at least 100,000, about half of adults are estimated to be at or below Level 1 literacy.
Roughly 1 in 5 U.S. Adults Are Estimated to Be at or Below Level 1 Literacy
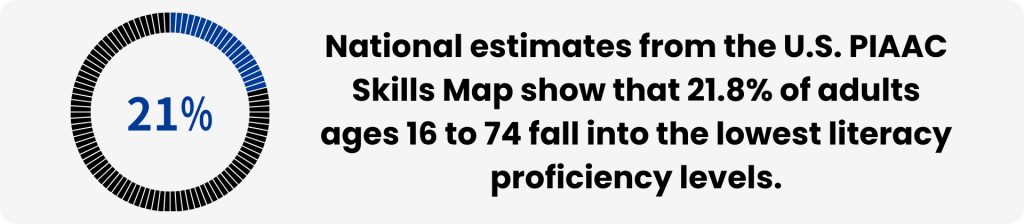
National estimates from the U.S. PIAAC Skills Map show that 21.8% of adults ages 16 to 74 fall into the lowest literacy proficiency levels. 32.3% are estimated to be at Level 2 and 45.8% at Level 3 or above.
That makes low literacy a mainstream education and workforce issue rather than a marginal one. A practical framing for general readers is that more than one in five U.S. adults may struggle with reading tasks that require higher-level comprehension, synthesis, or navigation of written materials.
A Small Number of Large States Account for Much of the Low-Literacy Population
Our analysis shows that the largest numbers of adults at or below Level 1 literacy are concentrated in a handful of large states, led by California, Texas, New York, Florida, and Illinois. California is estimated to have about 8.2 million adults at or below Level 1 literacy, followed by Texas at about 5.6 million, New York at about 3.6 million, Florida at about 3.5 million, and Illinois at about 1.9 million.
Together, the top 10 states by number of adults at or below Level 1 account for about 59.7% of the total low-literacy population across states. This concentration suggests that national literacy outcomes are heavily shaped by a relatively small set of high-population states.
State-Level Literacy Gaps Are Wide
The data shows that the highest shares of adults at or below Level 1 literacy appear in New Mexico, California, Texas, Mississippi, and Louisiana. The lowest shares appear in New Hampshire, Alaska, Vermont, Minnesota, and Montana.
New Mexico’s low-literacy share of 29.1% is about 2.5 times New Hampshire’s 11.5% share. This wide spread shows that adult literacy varies sharply by geography and that statewide context matters alongside individual background.
Highest-share states (At or below Level 1):
- New Mexico — 29.1%
- California — 28.4%
- Texas — 28.2%
- Mississippi — 28.0%
- Louisiana — 27.1%
Lowest-share states (At or below Level 1):
- New Hampshire — 11.5%
- Alaska — 12.7%
- Vermont — 12.8%
- Minnesota — 13.1%
- Montana — 13.1%
County-Level Differences Are Even Sharper Than State Gaps
Among counties with populations of at least 100,000, our data shows that several places have estimated low-literacy shares near or above 50%.
Counties with highest share at/below Level 1:
- Hidalgo County, Texas — 54.1%
- Webb County, Texas — 52.8%
- Cameron County, Texas — 52.2%
- Imperial County, California — 50.0%
- Bronx County, New York — 49.9%
Educational Attainment Is the Clearest Dividing Line
The strongest pattern in the national estimates is the relationship between literacy and educational attainment. Adults with less than a high school education are estimated to have a 54.6% share at or below Level 1 literacy, compared with 31.4% among high school graduates, 14.2% among adults with some college, and 5.3% among adults with a bachelor’s degree or higher.
Therefore, adults with less than a high school education are about 10 times as likely to be at or below Level 1 literacy as adults with a bachelor’s degree or higher. The share at Level 3 or above also rises sharply with education, from 14.9% among adults without a high school diploma to 73.9% among adults with at least a bachelor’s degree.
By age, the lowest low-literacy shares appear among adults ages 25 to 34 and 16 to 24, while the highest appears among adults ages 65 to 74. Nationally, the estimated shares at or below Level 1 are 16.6% for ages 16 to 24, 16.4% for ages 25 to 34, 21.8% for ages 35 to 44, 25.3% for ages 45 to 54, 24.5% for ages 55 to 64, and 31.8% for ages 65 to 74.
Still, the age gap is smaller than the education gap. Together, these gaps suggest that expanding realistic pathways to postsecondary education for adults is one of the most effective ways to strengthen literacy skills over time.
For adult-serving institutions such as National University, these findings highlight a clear opportunity: expanding flexible, career-aligned education pathways can help adult learners build both credentials and the advanced literacy skills needed for long-term career mobility.
Methodology
Data Source
The analysis is based primarily on the U.S. PIAAC Skills Map, also described by NCES as the State and County Indicators of Adult Literacy and Numeracy. This resource uses small-area estimation to extend the U.S. Program for the International Assessment of Adult Competencies to all 50 states and 3,141 counties for adults ages 16 to 74.
The Skills Map pools results from the U.S. PIAAC cycles administered in 2012, 2014, and 2017 and combines them with demographic and geographic covariates to produce modeled local estimates. Because these are modeled estimates rather than direct county-by-county surveys, they are best interpreted as population-level indicators of likely literacy distributions rather than exact headcounts.
Literacy Categories
The study uses the literacy categories provided in the Skills Map: at or below Level 1, Level 2, and Level 3 or above. NCES and OECD materials describe adults at or below Level 1 as more likely to struggle with reading tasks that involve integrating information, making more complex inferences, or navigating denser written materials.
Throughout the analysis, “low literacy” refers to the share of adults estimated to be at or below Level 1 literacy. This label is used as a practical shorthand for comparison and does not imply that adults in this category lack all reading ability.
Scope and Calculations
National, state, and county findings were derived from the Skills Map estimates for adults ages 16 to 74. Rankings of states by low-literacy population combine the estimated percentage at or below Level 1 with the estimated adult population in each state.
For the county analysis, the focus is on counties with populations of at least 100,000 in order to emphasize places large enough to be broadly recognizable to readers and more comparable across regions. The “top 10 states” concentration statistic was calculated by summing the estimated number of adults at or below Level 1 in the 10 highest-count states and dividing by the national total across states.
Demographic Comparisons
Education- and age-based comparisons draw on national PIAAC distributions summarized in NCES and OECD materials. Ratios such as the roughly 10-to-1 gap between adults without a high school diploma and adults with at least a bachelor’s degree were calculated directly from the reported shares.
Limitations
This study relies heavily on modeled estimates rather than direct county survey counts, which introduces uncertainty at local levels even when the patterns are directionally strong. The analysis also focuses on adults ages 16 to 74, so it does not describe literacy among children or adults older than 74.
In addition, literacy in PIAAC is measured as proficiency in applied reading tasks rather than as a simple literate/illiterate binary. As a result, phrases such as “low literacy” or “at or below Level 1” are more accurate than absolute labels that suggest complete inability to read.